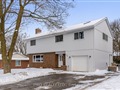
26 Waterford Dr
$795,511
Comparative Market Analysis
Jul 5, 2025
NOT AN ACTIVE LISTING
Historical Performance
| Period | $ Change | % Change |
| 1 Day | +$53 | +0.007% |
| 7 Days | -$414 | -0.052% |
| 30 Days | -$2,475 | -0.310% |
| 3 Months | -$2,938 | -0.368% |
| 6 Months | +$14.4k | +1.85% |
| 1 Year | -$37.6k | -4.51% |
| 3 Years | +$139k | +21.1% |
| 5 Years | +$227k | +40.0% |
| 10 Years | +$428k | +116% |
List My Property
Real Estate Statistics
Financing Solutions
AS SEEN ON


Are You a Licensed Real Estate Agent or Broker?