SALES HISTORY
MARKET STATS
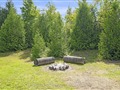
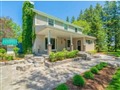
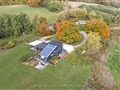
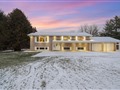
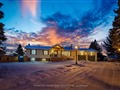
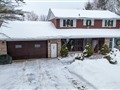
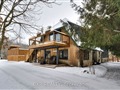
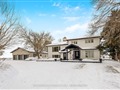
PROPERTY DESCRIPTION
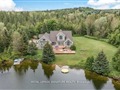
33 Sandalwood Dr is a 3-bedroom 3-washroom detached house located in Rural Erin community of Erin. It is currently NOT FOR SALE, but is
worth in our opinion around $1,188,026
.
The property is situated on a 125' frontage by 314' deep lot. 33 Sandalwood Dr is currently not for sale and is not an active listing on Listing.ca.
NEARBY SCHOOLS
Dufferin-Peel Catholic District School Board
4.2 km
RR 5 Stn Main, L7G4S8
Phone: (905) 873-4652
Halton Hills Christian School
2.5 km
11643 Trafalgar Rd, L7G4S4
Phone: (905) 877-4221
NEARBY MEDICAL CENTRES
East Wellington Family Health Team
11.7 km
1-6 Thompson Cres SS 1, N0B1T0
Phone: (519) 833-9396
East Wellington Family Health Team
20.1 km
A 175 Alma, N0B2K0
Phone: (519) 856-4611
Kulhay Wellness Clinic & Educational Centre
11.7 km
165 Main, N0B1T0
Phone: (519) 833-0031
Sherrington Chiropractic & Acupuncture Clinic
11.7 km
18 Thompson Cres SS 1, N0B1T0
Phone: (519) 833-2946
NEARBY GROCERY STORES
Dar's Country Market
38.8 km
6458 Wellington Road 7, N0B1S0
Phone: (519) 846-8600
Foodland
20.1 km
102 Trafalgar, N0B1Z0
Phone: (519) 855-4512
Foodland
20.1 km
208 Alma, N0B2K0
Phone: (519) 856-2577
Grand Gourmet
38.8 km
42 West Mill, N0B1S0
Phone: (519) 846-5771
L & M Food Market
38.8 km
169 Geddes St, N0B1S0
Phone: (519) 846-0470
L & M Food Market (Head Office)
38.8 km
165 Geddes St, N0B1S0
Phone: (519) 846-1188
NEARBY LIQUOR STORES
LCBO
11.7 km
41 Main Street, N0B1T0
Phone: (519) 833-9371
Liquor Control Board Of Ontario
32.8 km
24 Airport Rd, L0N1E0
Phone: (905) 584-9455